(UNIT : Baht million)
| FY 2020 | FY 2021 | FY 2022 | FY 2023 | FY 2024 | |
|---|---|---|---|---|---|
| STATEMENT OF COMPREHENSIVE INCOME | |||||
| Revenue from sale of goods and services | 75,479 | 118,275 | 110,657 | 84,245 | 114,374 |
| EBITDA | 20,505 | 32,439 | 10,391 | 3,985 | 7,754 |
| Profit (Loss) before tax | 17,064 | 28,718 | 6,167 | (527) | 2,343 |
| Profit (Loss) attribute to owners of the Company | 9,531 | 15,847 | 4,795 | (434) | 1,670 |
| STATEMENT OF FINANCIAL POSITION | |||||
| Total assets | 93,117 | 114,527 | 117,084 | 111,737 | 131,208 |
| Total liabilities | 39,720 | 49,479 | 47,897 | 43,591 | 61,513 |
| Total equities | 53,397 | 65,049 | 69,186 | 68,146 | 69,695 |
| FINANCIAL RATIOS | |||||
| Gross profit margin (%) | 28.9 | 32.2 | 14.3 | 9.7 | 9.5 |
| Net profit margin (%) | 12.6 | 13.4 | 4.3 | (0.5) | 1.5 |
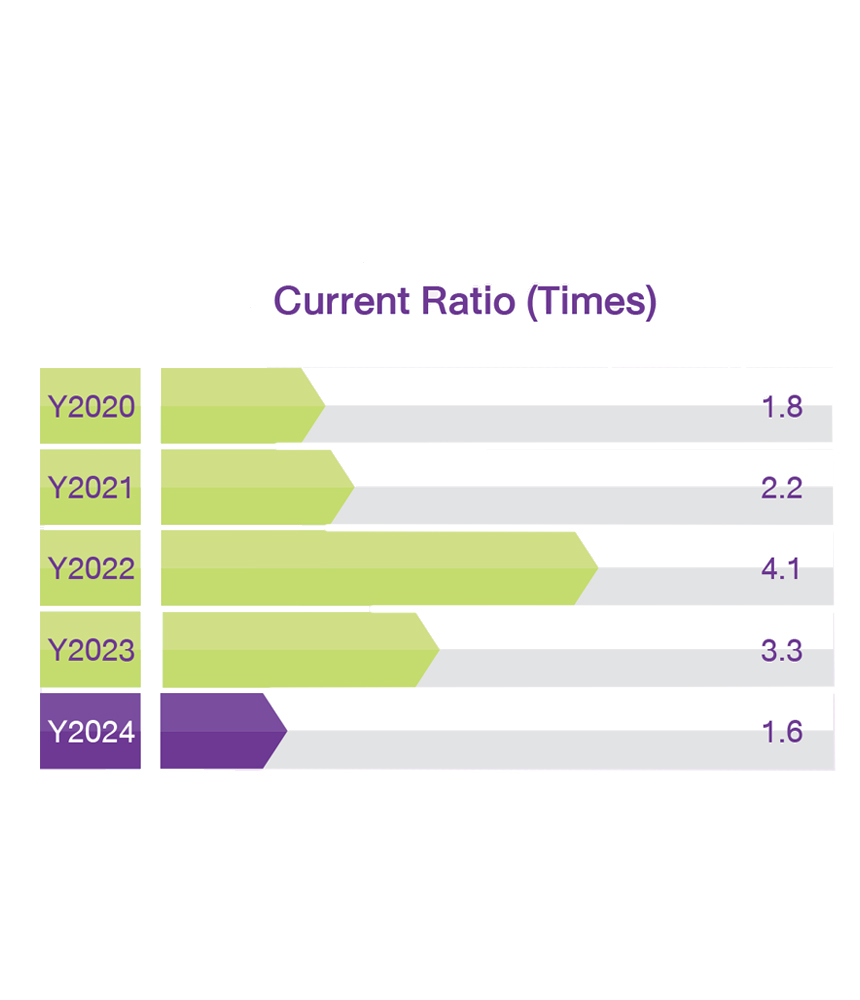
| Current ratio (times) | 1.8 | 2.2 | 4.1 | 3.3 | 1.6 |
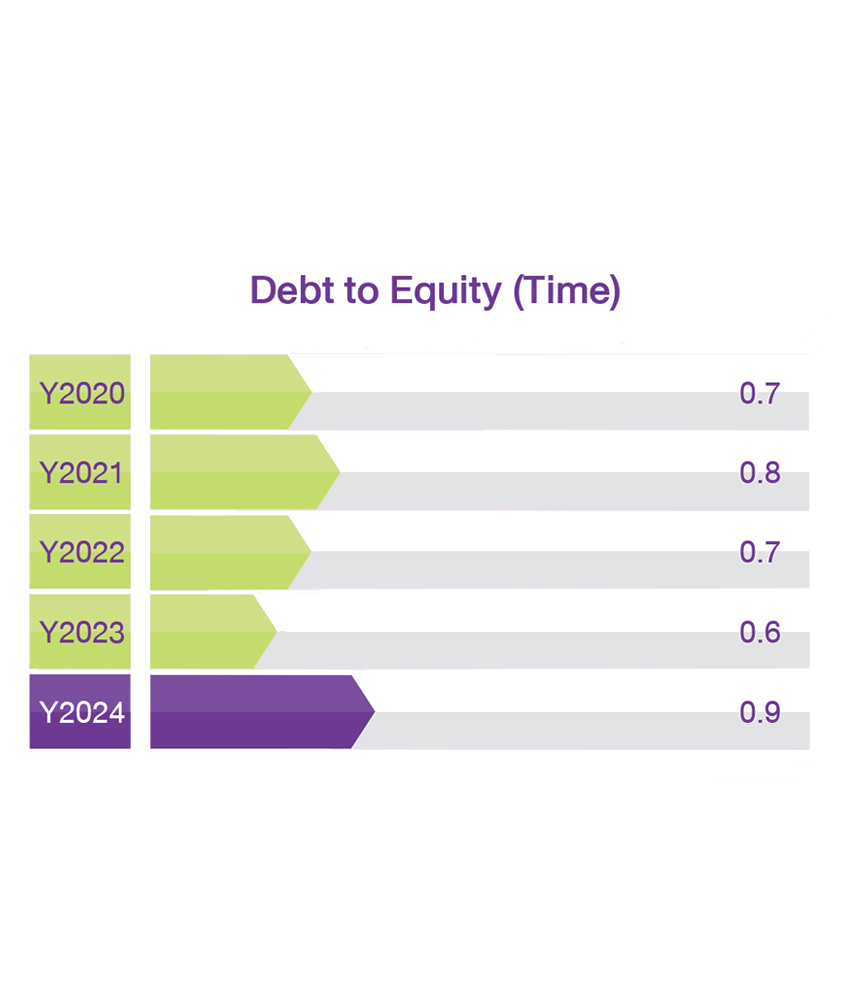
| Debt to equity ratio (times) | 0.7 | 0.8 | 0.7 | 0.6 | 0.9 |
| Dividend payout ratio (%) | 36.2 | 40.2 | 64.1 | N/A | 91.96 |
Note:
The financial ratio is calculated referred to the guideline of Form 56-1 preparation.